

Lazy evaluation for streaming statistics
Trace lazy filtering and a running mean through six source values, then compare reported throughput when a consumer stops early.
Download A1 poster (PDF)Research paper
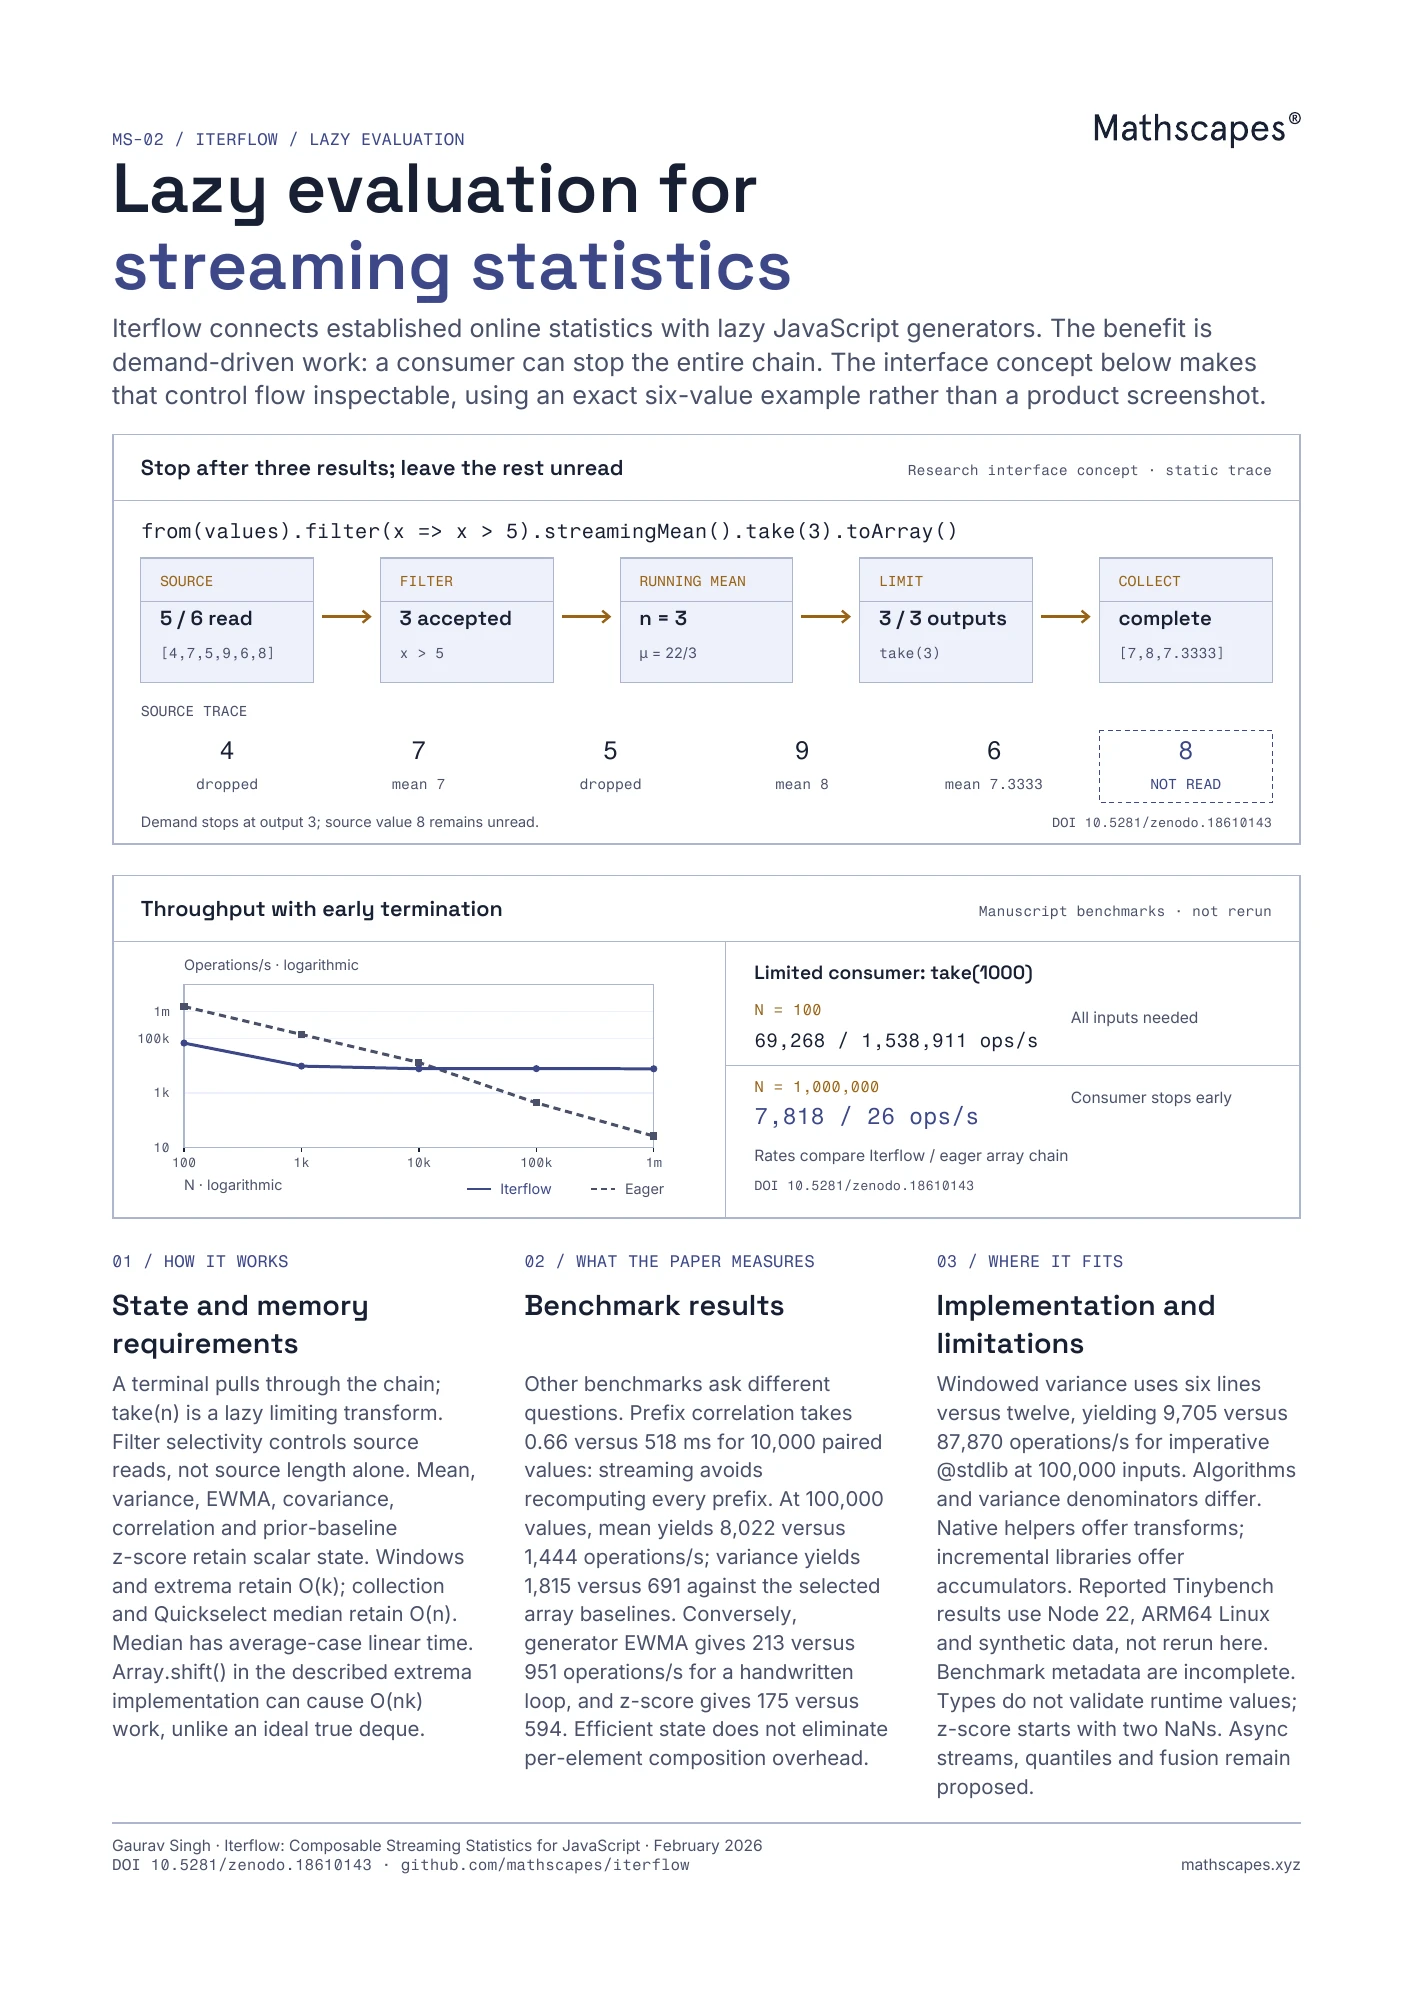
The source trace is a computed six-value example. The throughput chart reproduces reported manuscript benchmarks; these were not rerun. This is one of four portfolio perspectives on the same paper.
Source trace
The source [4, 7, 5, 9, 6, 8] passes through filter(x > 5), streamingMean() and take(3). The consumer receives [7, 8, 22/3]. Only five source values are read; the final 8 remains unread.
Memory requirements
Scalar online estimators retain constant-size state. Sliding windows retain O(k) values. Collecting outputs and computing a median can require O(n) storage.
Reported throughput
With take(1000), Iterflow reports 69,268 versus 1,538,911 operations/s for an eager array chain at N = 100, and 7,818 versus 26 at N = 1,000,000. Early termination reduces work; generator overhead can dominate when all inputs are needed.
Benchmark limitations
Results use synthetic data on Node 22 and ARM64 Linux. They were not rerun. Algorithms, variance denominators and implementation choices differ across some comparisons.
Source
Iterflow: Composable Streaming Statistics for JavaScript
Supporting source. Original visual explanation by Mathscapes. Research findings and illustrative calculations are identified above.