

Classifying auxetic deformation
Follow a re-entrant honeycomb from simulation and plastic-hinge images to cluster labels, then examine what the reported classifier agreement can tell us.
Download A1 poster (PDF)Research paper
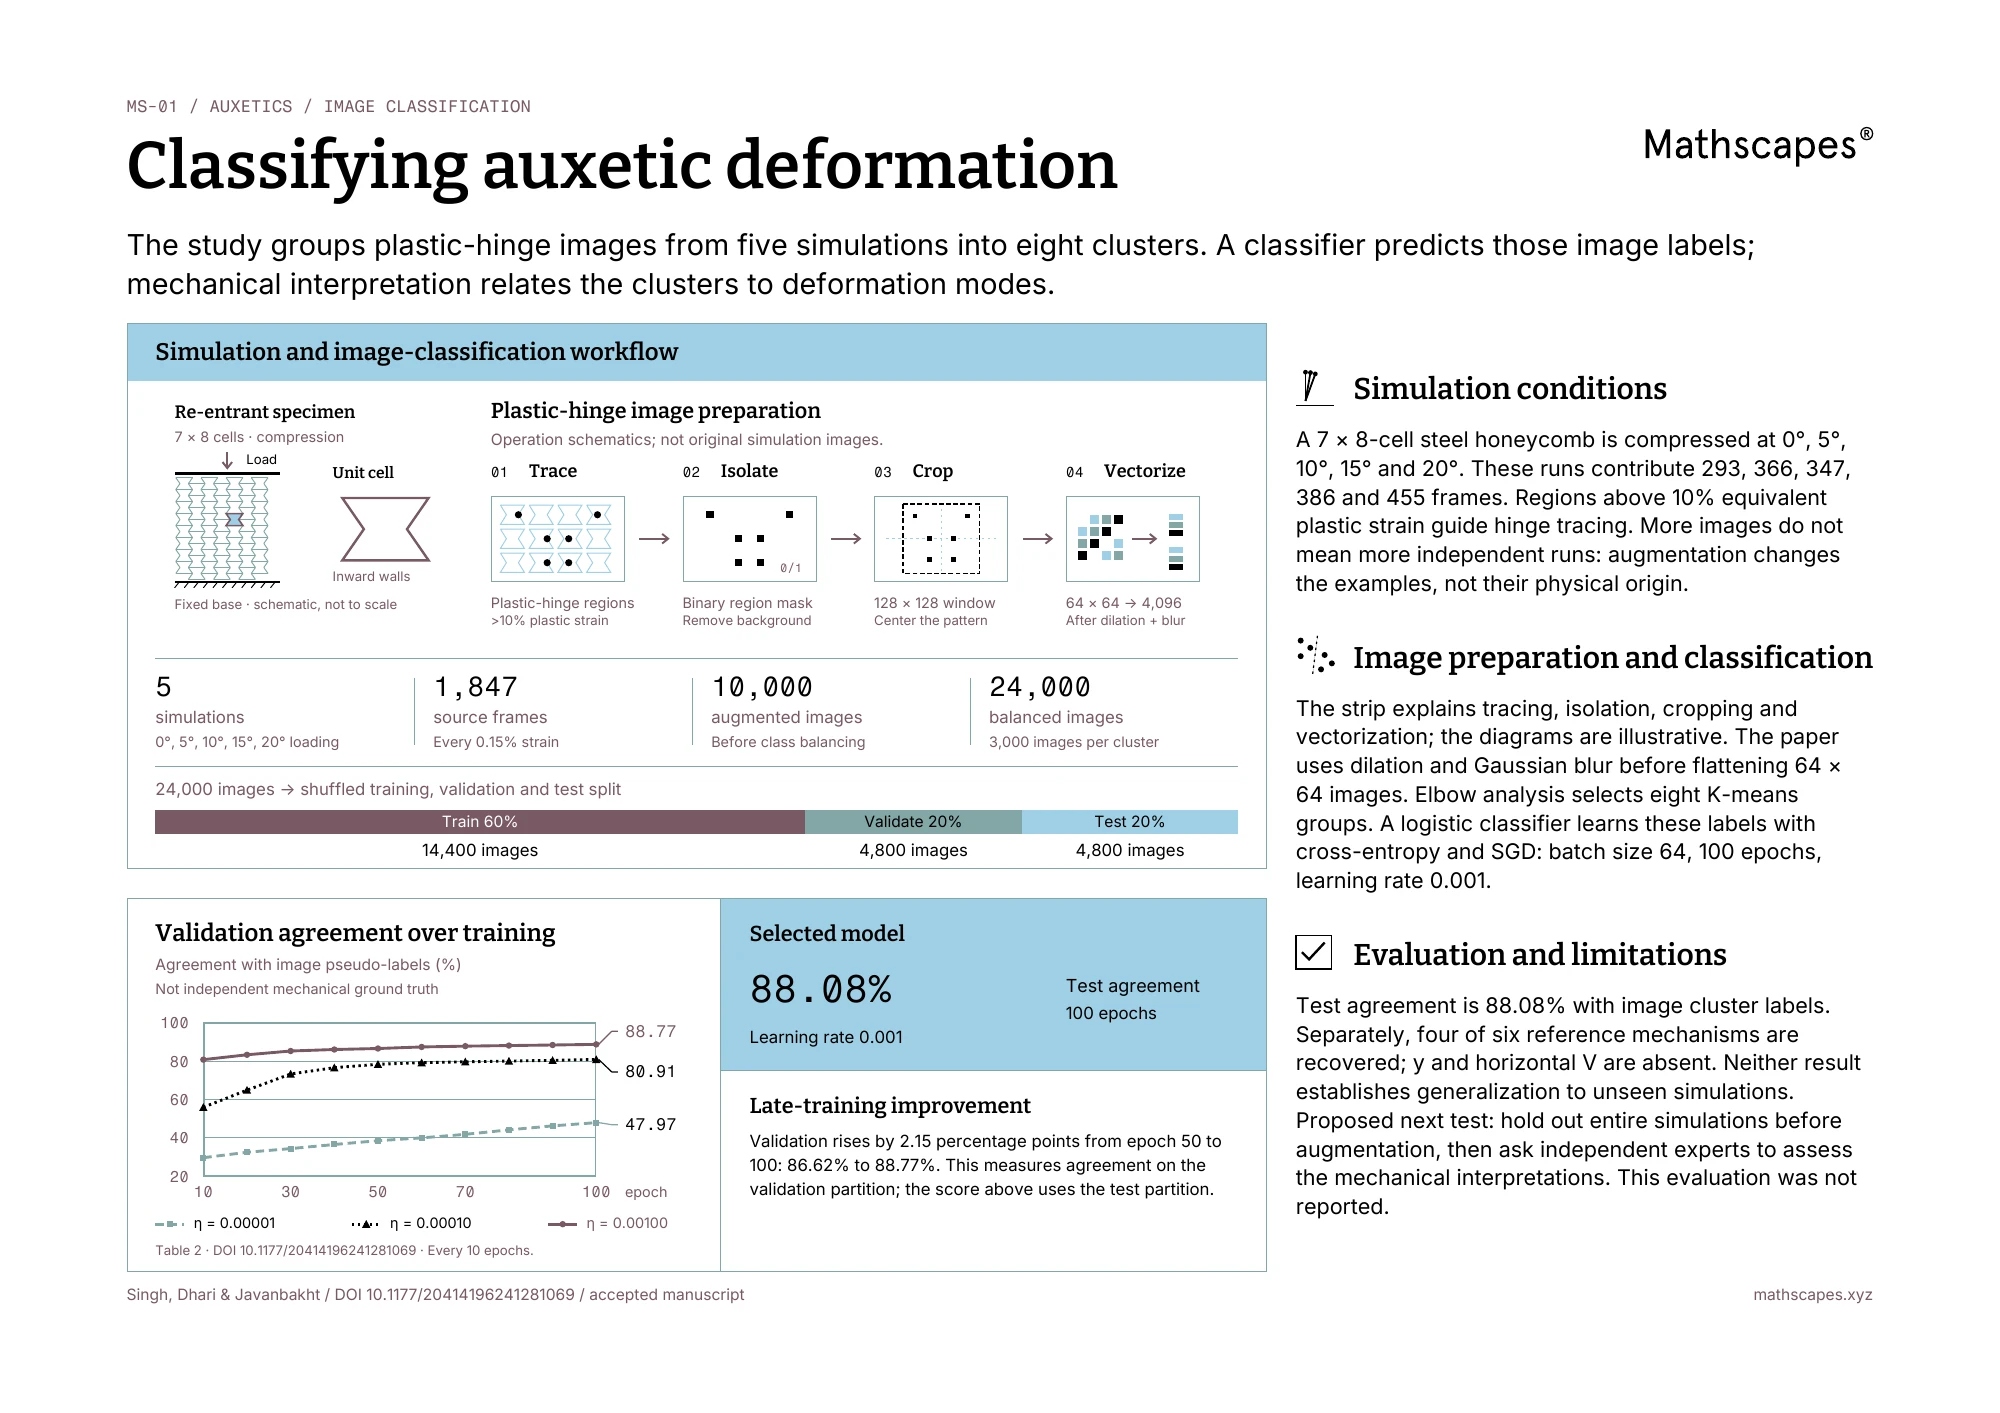
An original research interpretation of the accepted manuscript. The specimen and image-processing strip are explanatory illustrations, not original simulation output. Reported results are distinguished from a proposed evaluation. This is one of two portfolio perspectives on the same paper.
Sample provenance
A 7 × 8-cell plane-stress model produces 1,847 frames across five loading angles. Augmentation yields 10,000 images; 64 × 64 pixels supply 4,096 features. K-means uses eight clusters. Balancing by augmentation then yields 24,000 images, with 3,000 per cluster.
What becomes an image
Regions above 10% equivalent plastic strain guide plastic-hinge tracing. The operation schematics distinguish a structure with highlighted regions, a binary mask, a centered 128 × 128 crop, and flattening the prepared 64 × 64 image into 4,096 values. Dilation and Gaussian blur precede the final input. These are explanatory diagrams, not measured strain fields or original simulation images.
Evaluation
The augmented images are shuffled into 60% training, 20% validation and 20% test partitions: 14,400, 4,800 and 4,800 images. At learning rate 0.001, batch size 64 and 100 epochs, the manuscript reports 88.77% validation and 88.08% test accuracy against cluster-derived labels.
Interpretation
Agreement with a cluster label is different from independently verified mechanical truth. Four of six refers to recovered reference mechanisms; y and horizontal V were not recovered. Our proposed next evaluation holds out entire simulations before augmentation and asks independent experts to assess mechanical interpretations. This evaluation was not reported.
Source
Supporting source. Original visual explanation by Mathscapes. Research findings and illustrative calculations are identified above.